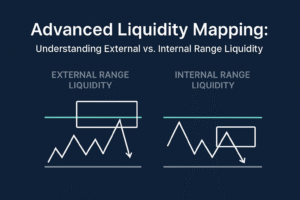
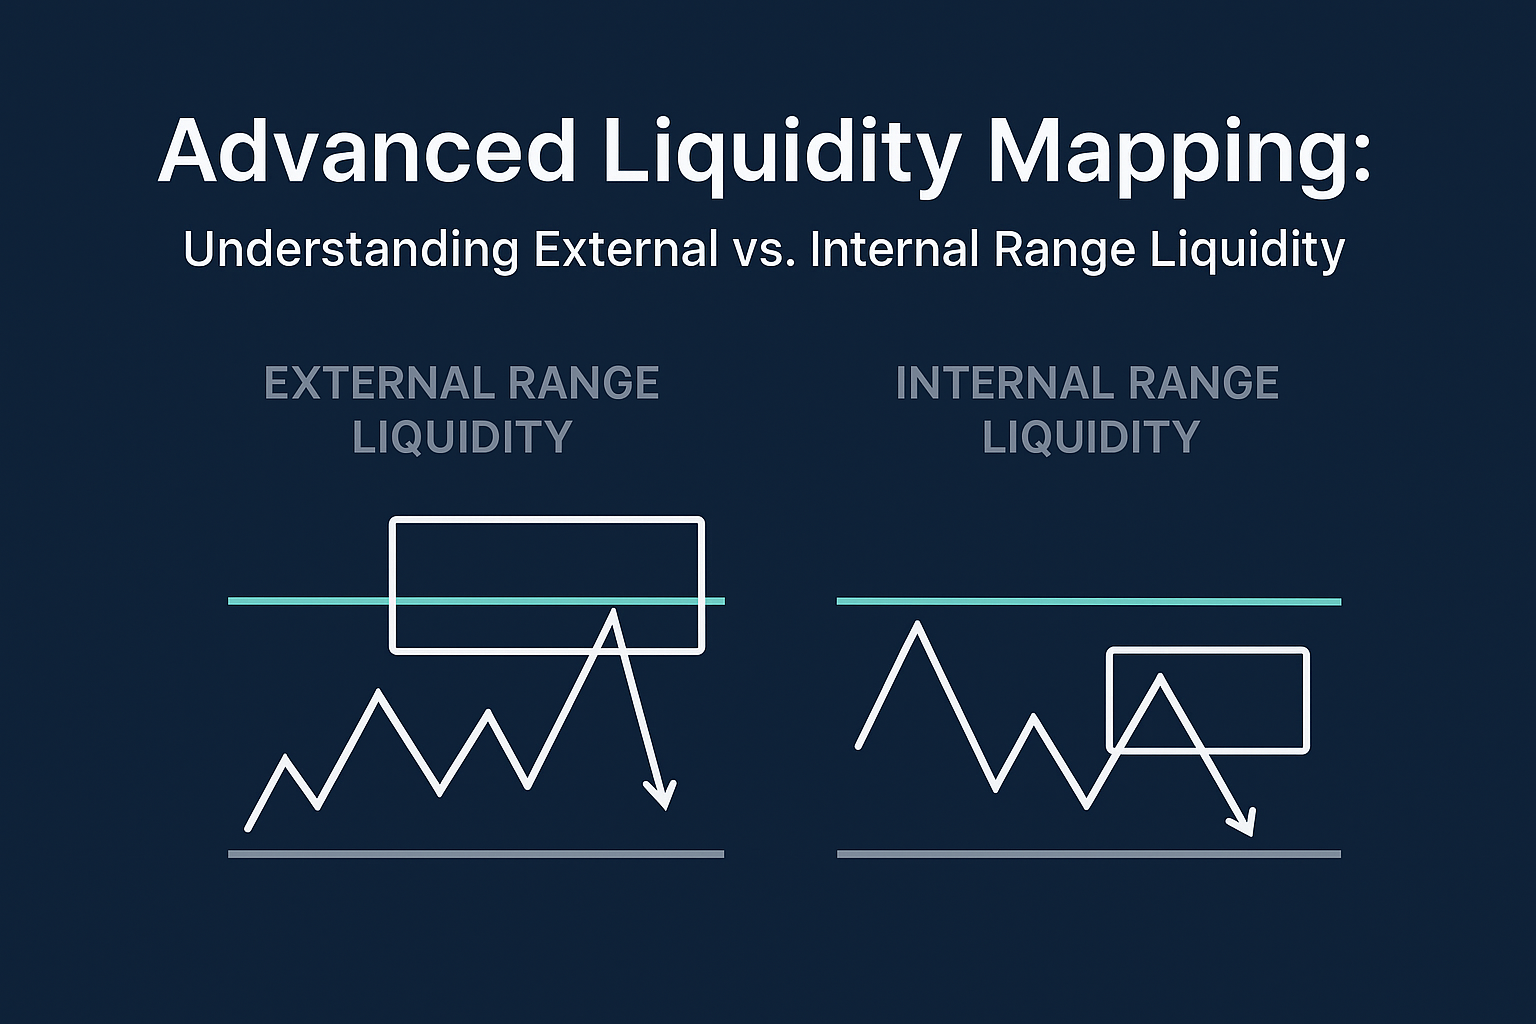
In modern trading, especially in the context of institutional and “smart money” flows, understanding where liquidity resides—and how price moves to capture it—can offer a real edge. This article explores two key liquidity concepts: external range liquidity (ERL) and internal range liquidity (IRL). We will examine what they are, how they differ, how price cycles between them, how to identify them on charts, and how to incorporate them into your strategy for improved timing and bias.
What is Liquidity Mapping?
Liquidity mapping refers to identifying zones where orders are resting (such as stop-loss orders, breakout entries, pending orders) and understanding how price tends to be drawn toward those zones. Rather than viewing price movement simply as random or purely pattern-driven, liquidity mapping emphasizes that “price moves to where liquidity lives”.
The logic: Larger players (institutions, banks) need resting orders to execute big trades with less slippage. Retail traders leave many of their stops or breakout entries at logical levels (highs/lows, consolidation breaks). By knowing roughly where these rest, a trader can anticipate when the price may be drawn to sweep those zones and then reverse or resume the trend.
The concepts of internal range liquidity and external range liquidity fit neatly into this paradigm.
Defining the Concepts
External Range Liquidity (ERL)
External range liquidity refers to the pools of orders that lie outside the current defined trading range (dealing range). Typically, these are the stop-losses or breakout entries lying just above a previous swing high or just below a previous swing low.
Key features:
-
Located at extremes of a range: above swing highs / below swing lows.
-
Often, where breakout traders place orders, or where retail traders’ stops accumulate.
-
Because these zones often contain concentrated liquidity, price is often drawn-to or manipulated to these zones in order to fill large orders or trigger stops.
Internal Range Liquidity (IRL)
Internal range liquidity refers to the pools of orders that lie within the boundaries of a defined trading range (between a swing high and swing low). This includes things like fair value gaps (FVGs), order blocks, or other imbalances within the range.
Key features:
-
Located inside the range, between the established high and low of the dealing range.
-
Typically smaller, more frequent volume of orders compared to external liquidity, but nonetheless meaningful for price movement.
-
Often targeted after the major external zone has been addressed, or as part of retracement or consolidation phases.
The Dealing Range Framework
To frame IRL and ERL, we first define the concept of a “dealing range” (also called trading range) as used in this context.
A dealing range is the area between an established swing high and an established swing low where price has previously created structure (i.e., a high that took out a previous high, or a low that took out a previous low).
Within that range:
-
The external range is the high and low of that dealing range (the boundaries).
-
The internal range is everything inside the range, especially imbalances like fair-value gaps.
Hence, mapping liquidity involves:
-
Identifying the dealing range (swing high & low)
-
Marking external liquidity zones just outside the range (ERL)
-
Marking internal liquidity zones inside the range (IRL)
-
Observing how the price moves between these zones (more in the next section)
How Price Moves Between IRL and ERL
General cycle
According to many traders following the “smart money” or ICT style, price tends to move in a cycle: from external range liquidity → internal range liquidity → back to external range liquidity.
In other words:
-
The price may first sweep an external liquidity zone (e.g., old high)
-
Then it may retrace into an internal liquidity zone (e.g., fair value gap) to rebalance the market.
-
Then it moves toward the next external liquidity zone (new swing high or low)
This cyclical behavior allows one to anticipate potential targets or turning zones.
Why does this flow happen?
Because large players need resting orders (liquidity) to fill their trades. They may:
-
Trigger stop-losses of retail traders at external highs/lows to gain liquidity.
-
Then use internal zones (imbalances) to rebalance or to accumulate or distribute.
-
Continue the move once the liquidity is cleared, hence pushing to the next external zone.
Time-frame and risk implications
-
External range liquidity zones are typically identified on higher timeframes (daily, weekly) where swing highs/lows reside.
-
Internal range liquidity zones may occur on lower timeframes (4-hour, 1-hour, even 15-minute) because they involve imbalances, fair value gaps, and intra-range orders.
-
Risk arises if a trader mistakes internal zones for external or misaligns the timeframe bias: e.g., treating an internal zone as a major target when the bigger move is still toward a higher timeframe external zone.
How to Identify ERL and IRL Zones on Charts
Here are practical steps:
Identifying External Range Liquidity
-
Look for previous clear swing high or swing low (on daily/weekly charts) where retail likely placed stops.
-
Mark the zone just beyond that high/low (where stop-losses may sit).
-
Observe where price has historically been drawn to or reversed from.
-
Example: A prior weekly high becomes a liquidity target; price may spike above it to grab stops and then reverse.
Identifying Internal Range Liquidity
-
Within the dealing range, look for fair value gaps (FVGs) — areas where the three-candle structure leaves an imbalance/unfilled zone.
-
Look for order blocks, consolidation zones, and minor swing highs/lows inside the range.
-
These zones often act as stepping-stones for price, or as retracement targets after a major move.
-
Use lower timeframe charts (4H, 1H, 15m) to refine entries around these internal zones.
Example Workflow
-
On the daily chart, mark the last swing high = the external boundary.
-
On the same chart and lower timeframes, mark the last swing low = external opposite boundary → thus define the dealing range.
-
Inside that range, inspect 4H/1H charts for fair value gap or consolidation → mark as internal zone.
-
Monitor for price to sweep one of the external zones → then retrace back into the internal zone → then anticipate next leg toward the opposite external zone.
-
Always align with higher timeframe bias (trend direction) and note that liquidity zones don’t guarantee reversal—they are targets or stepping-stones, not certainties.
Using IRL & ERL to Determine Daily Bias
An advanced application: using liquidity zones to gauge bias for the day or higher timeframe.
-
If price has already cleared an internal liquidity sweep and the next external zone lies above the current price → a bullish bias may be in play (price still has upside to capture external liquidity).
-
Conversely, if price cleared internal liquidity and the external zone lies below the current price → a bearish bias may dominate.
-
If an external liquidity zone was reached and price returned inside → expect potential consolidation or reversal from internal zones.
-
Always combine this with higher timeframe structure: e.g., if weekly trend is up, then external above is more likely target than external below.
Strategy Applications & Trade Setup Ideas
Entry techniques
-
Wait for a liquidity sweep of external zone: e.g., price spikes above swing high (ERL) then reverses.
-
Wait for price to retrace into the internal zone (IRL) for entry: e.g., a fair value gap shows up, price retests it with confirmation.
-
Use stop-loss placement just beyond the external or internal zone, depending on risk tolerance.
Timeframe stacking
-
Use weekly/daily to mark external zones.
-
Use 4H/1H to mark internal zones and see structure breaks.
-
Use 15m for precise entry once the price comes into the internal zone and shows a reversal signal.
Risk management
-
Recognize that internal zones often carry more frequent but smaller moves; external zones may carry higher reward but also higher risk.
-
Avoid entering a short-term trade in an internal zone against a still-untouched external zone alignment with the trend.
-
Use liquidity mapping as one tool among others (volume, structure, trend, confluence), not in isolation.
Example scenario
Suppose the daily chart of EUR/USD shows a prior swing high at 1.1100 (ERL). The current price is at 1.1000.
-
Mark the swing high as the external zone.
-
Inside the range between the prior swing low at 1.0900 and that 1.1100 high, you spot a fair value gap at ~1.0950 on the 4H chart (IRL).
-
Price initially spikes above 1.1100 → triggers stops → then retraces into 1.0950 → you wait for confirmation and take a long toward 1.1100 as the next external target, aligning with bullish bias.
Common Mistakes & Pitfalls
-
Confusing internal and external zones: Treating an internal fair value gap as the final big target when a larger external zone remains uncollected.
-
Ignoring higher timeframe direction: Trying to trade against a weekly trend that is pointing toward an external zone, you are neglecting.
-
Over-relying on liquidity zones only: Liquidity mapping is powerful, but should be used with structure, price action, and context.
-
Poor timeframe alignment: Using too small a timeframe to identify external zones or too large for internal zones—leading to misplacement and misinterpretation.
Advanced Insights & Pro Tips
-
Use order-flow or tape reading (if available) to confirm when liquidity is being swept (e.g., spike in volume as price touches an ERL).
-
Watch for changes of character or structure breaks near these zones to signal that liquidity capture may have taken place.
-
Combine liquidity zones with session highs/lows, previous day/week highs/lows, and major pivot points, as these often coincide with external liquidity.
-
In trending markets, external zones aligned with the trend become higher-probability targets; in ranging markets, internal zones may dominate.
-
Always back-test your approach on the instrument/timeframe you trade: mapping liquidity zones is conceptually the same, but each instrument behaves differently.
Summary & Key Takeaways
-
External Range Liquidity (ERL) = zones outside the dealing range (old highs/lows) where large concentrations of stops and breakout entries accumulate.
-
Internal Range Liquidity (IRL) = zones inside the dealing range (fair value gaps, imbalances) where orders accumulate within the range.
-
Price often cycles between IRL and ERL: sweeping external → retrace internal → target external (or vice versa) for liquidity.
-
Identifying these zones allows traders to anticipate where the price might go, align bias, and refine entries.
-
Use multi-timeframe analysis, combine with structure & confirmation, and avoid using liquidity mapping in isolation.
-
Align with higher timeframe trend and avoid trading against unfulfilled external liquidity targets unless there’s a strong structural reason.
Conclusion
Mastering liquidity mapping via internal vs external range liquidity gives traders an advanced lens through which to view price movement—not simply as patterns, but as a flow of orders being chased by large players. By identifying where liquidity pools lie and understanding how price moves to sweep those pools and rebalance, you gain directional clarity, refined entry opportunities, and a better understanding of risk.
Use this framework to overlay on your charts, identify your IRL and ERL zones, and practise entries with discipline. Over time, this will sharpen your trading edge and improve both your timing and strategy quality.


