In Smart Money Concepts (SMC) trading, professionals read the market in terms of institutional intent: liquidity, supply/demand imbalances, and order flow. Two related but distinct concepts dominate the interpretation of trend and reversal: the Break of Structure (BOS) and the deeper, confirmation-focused Market Structure Shift (MSS).
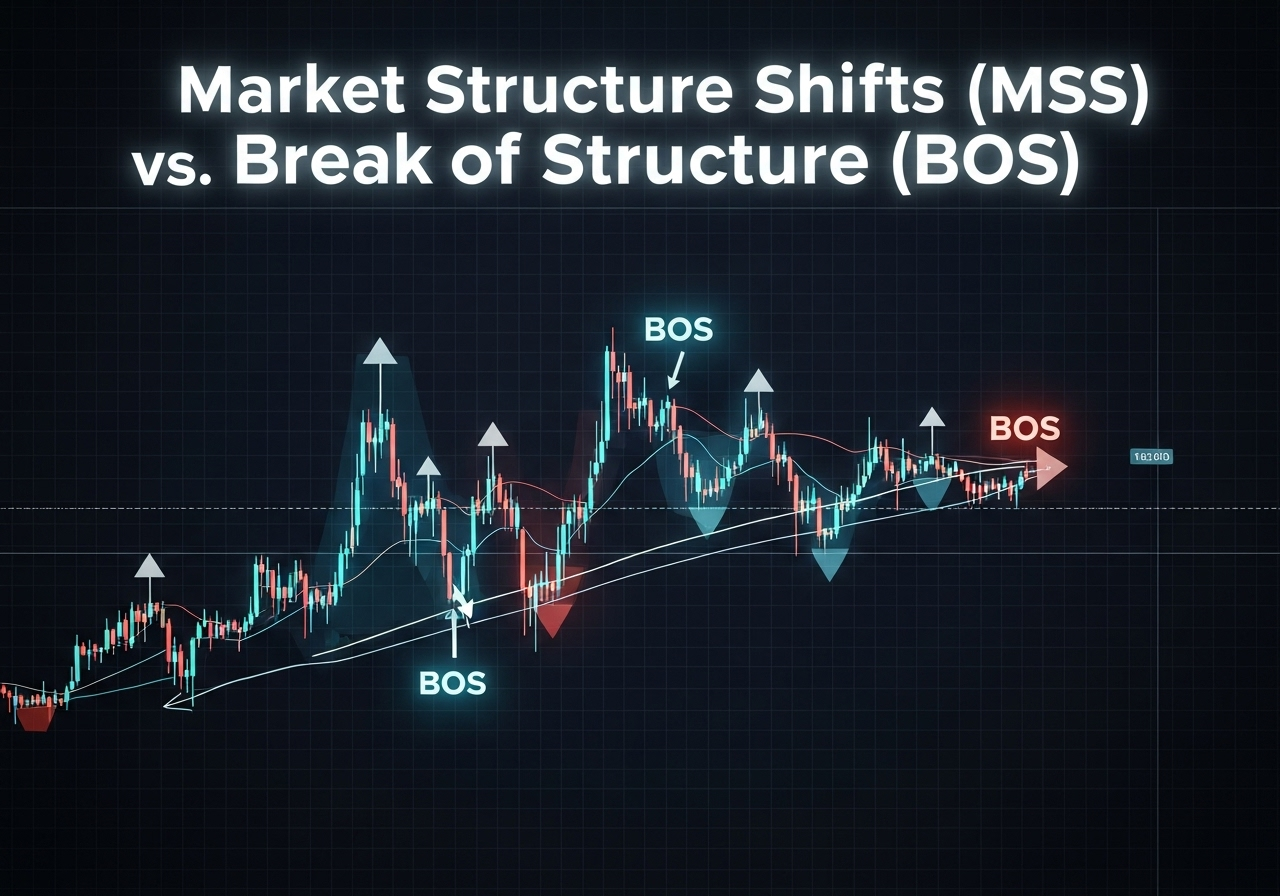
Short version: a BOS is a price-level breach (the market broke a previous high/low) and often signals trend continuation; an MSS is when price action, liquidity behavior, and confirmed institutional footprints together indicate the market has likely changed regime (trend reversed or a new trend forming).
Definitions: BOS, MSS, FVG, and Order Blocks (practical SMC lens)
Break of Structure (BOS)
A BOS occurs when price decisively breaks an established swing high (in an uptrend) or swing low (in a downtrend). Traders use BOS as a simple, objective signal: a series of higher highs and higher lows is interrupted, or lower lows and lower highs continue.
Market Structure Shift (MSS)
MSS is a higher-confidence classification: price not only breaks a structure level but then demonstrates institutional-style behavior — rejection at liquidity zones, creation of validated Order Blocks, acceptance/retest of Fair Value Gaps (FVGs), and balanced multi-timeframe confirmation. MSS implies a change in the market’s directional bias, not simply a temporary breakout.
Supporting SMC primitives
- Order Block (OB): the last opposing directional candle(s) where institutions accumulated/distributed before a directional expansion. (See TradingView guides for order block examples.)
- Fair Value Gap (FVG): a rapid price movement that leaves an imbalanced area that is often retested later. It is useful for judging accepted liquidity.
- Liquidity sweep / Stop hunt: a fast move beyond visible stops that returns, often a trap for retail traders and a liquidity gathering technique for institutions.
How to distinguish MSS from BOS — a step-by-step practical framework
Below is a reproducible checklist you can apply across markets and timeframes. For each candidate BOS, run through these steps to judge if it qualifies as an MSS.
Step 1 — Identify the BOS candidate
- Mark the prior structure: clear swing high/swing low on the timeframe you trade.
- Note whether the price closes beyond that swing with convincing volume or momentum on the chosen timeframe.
Step 2 — Check for institutional footprints (order blocks, FVG)
- Is there a nearby Order Block (OB) where the price was respected before the move? (Potentially indicates where institutions interacted.)
- Is there a Fair Value Gap left by the impulsive move that price could retest? FVG acceptance + OB confluence raises the MSS probability.
Step 3 — Liquidity behavior
- Was the break accompanied by a liquidity sweep (wick beyond visible stops) followed by quick rejection? That often signals distribution/accumulation, not genuine breakout continuation.
- If price reclaimed the broken level and closed inside the prior structure, treat it as a false breakout unless subsequent price action confirms a change.
Step 4 — Multi-timeframe confirmation
Confirm bias on at least one higher timeframe (HTF). An MSS on your execution timeframe that aligns with the HTF structure change has much higher reliability than a BOS only visible on the micro timeframe.
Step 5 — Entry model & risk management
Use a top-down entry model: HTF bias → MTF (e.g., 1H) structure → LTF (e.g., 5–15min) trigger candle and clean liquidity acceptance. Keep stops beyond the natural institutional liquidity cluster (e.g., beyond the OB + FVG cluster), and size for a defined R: R.
Example trade walkthrough (concise): EURUSD daily-to-15m
- Daily: prior up-structure; price fails to make a new high; large wick north indicates rejection at resistance (institutional supply).
- 4H: BOS below prior swing low followed by retest into an OB and FVG cluster (MSS forming).
- 1H->15m: Look for a clean bearish rejection candle at OB + FVG, enter on close of confirmation candle with stop above OB wick; target into next liquidity pocket.
This approach reduces chasing breakout continuation and focuses on institutional footprints that increase the probability of a true reversal.
MSS vs BOS Quick Checklist
- BOS: clear close beyond swing high/low on preferred timeframe
- OB within retest distance? (Yes / No)
- FVG present & likely to be retested? (Yes / No)
- Liquidity sweep or trap occurred? (Yes / No)
- HTF alignment for MSS? (Yes / No)
- Entry trigger on LTF validated? (Yes / No)
- Stop placement removes obvious institutional liquidity (Yes / No)
Best practices & pitfalls to avoid
Best practices
- Always validate with one higher timeframe — MSS is a multi-timeframe concept.
- Trade the retest, not the impulsive breakout — institutions often break then wait for liquidity to be grabbed.
- Use structural confluence: OB + FVG + HTF bias = stronger MSS signal.
Common pitfalls
- Chasing the immediate breakout without looking for OB/FVG confluence leads to many false trades.
- Over-reliance on indicator confirmations; price action + structure + liquidity reading should remain primary.
- Ignoring spread, slippage, and market-open liquidity in low-regulation markets (crypto) — these affect MSS reliability.
Further reading & official resources
For deeper foundational context (market structure, liquidity, and institutional flows), consult these resources:
-
- Investopedia — Introduction to Market Structure. (Good primer on how markets operate.)
-
- TradingView — chart examples & community streams. (Search ‘order blocks’ or shared scripts for visual templates.)
-
- FluxCharts — Break of Structure (BOS) explanation. (Clear BOS definitions and annotated examples.)
-
- TrendSpider — Fair Value Gap trading guide. (Practical FVG applications.)


